Workers in the Washington, DC, metro area dress for success and dress to impress.
Unlike startup hubs such as Silicon Valley and Austin, TX, workplace attire in DC tends to be rather formal. Think suits, not shorts. Think dress shoes, not flip-flops.
It’s no wonder, then, that workers in the nation’s capital — from the lobbyists on K Street to the politicos on Capitol Hill to the folks at countless offices around the metro — spend more per household on laundry and dry-cleaning services than any other major metro in the U.S.
In all, residents of the DC area forked over $201.3 million for laundry and dry-cleaning services in 2016, according to data that Press Cleaners obtained from Geographic Research, a supplier of location-based data. That’s a pittance when stacked up against the nearly $4 billion federal budget, but it’s still a considerable chunk of change.
If you stretch that $201.3 million across every household in the DC area, you come up with an average of $89.36 per household — the highest rate among the country’s 100 most populous metro areas. (The data excludes money spent at laundromats.)
While the per-household dollar figure might sound low, keep in mind that it covers every single household in the DC area. So whereas one household might spend $1,000 a year on laundry and dry-cleaning services, another might spend absolutely nothing.
Nonetheless, the per-household average gives us a sense of just how particular Washingtonians can be about their apparel.
Here’s our list of the Top 12 Metro Areas for Spending on Laundry and Dry-Cleaning Services.
1. Washington, DC

Total spent: $201.3 million
Average spent per household: $89.36
2. San Jose, CA
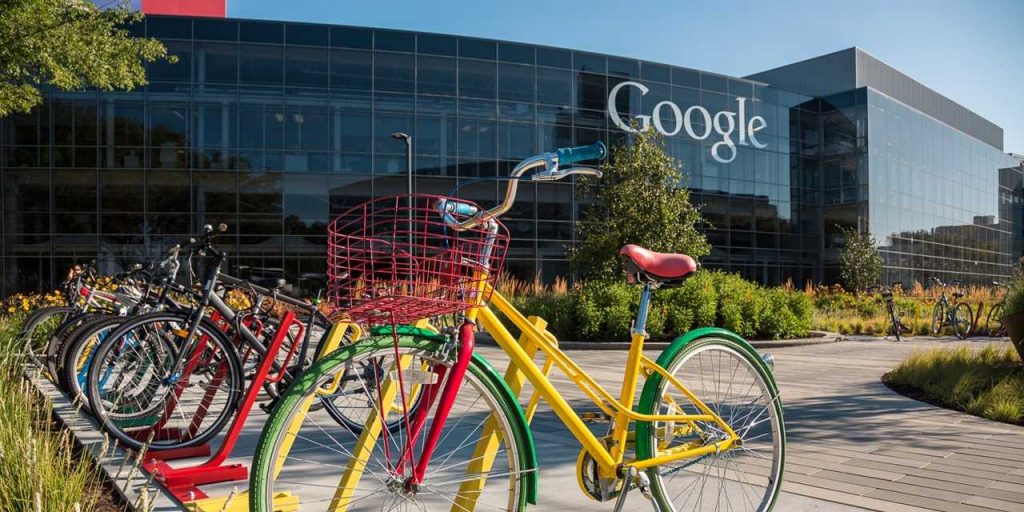
Total spent: $59.3 million
Average spent per household: $89.06
3. Bridgeport-Stamford-Norwalk, CT
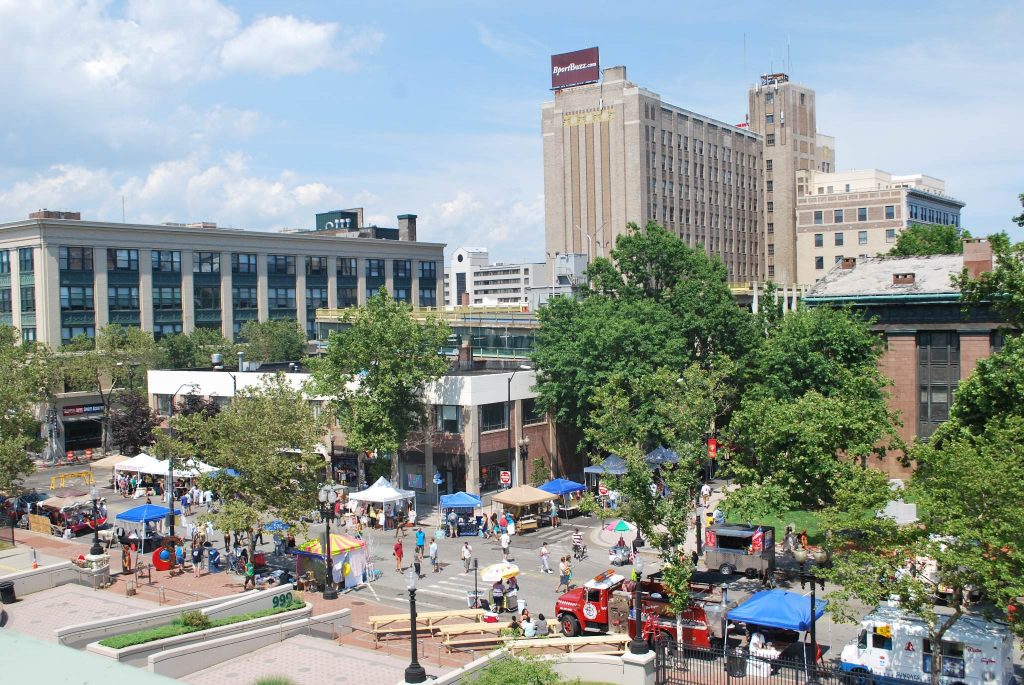
Total spent: $29.2 million
Average spent per household: $84.92
4. San Francisco, CA
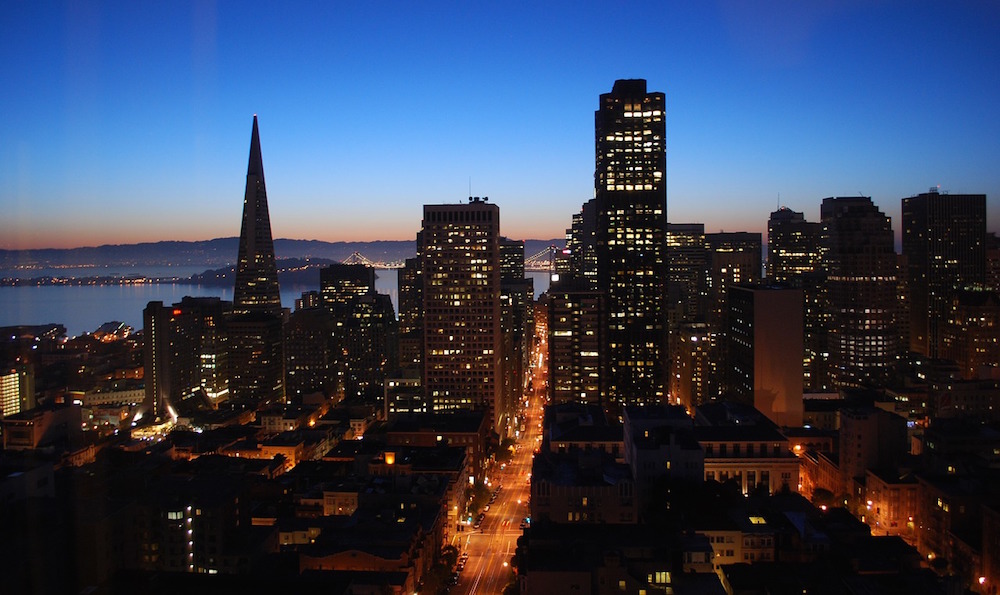
Total spent: $139.8 million
Average spent per household: $80.27
5. Oxnard-Thousand Oaks-Ventura, CA
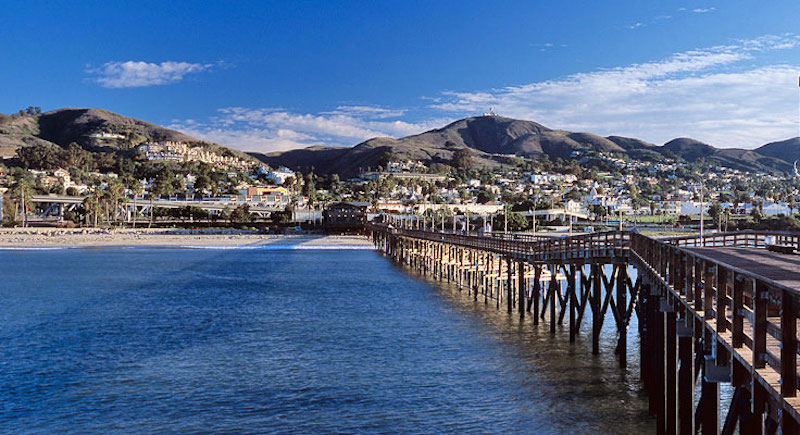
Total spent: $21 million
Average spent per household: $76.74
6. Boston, MA
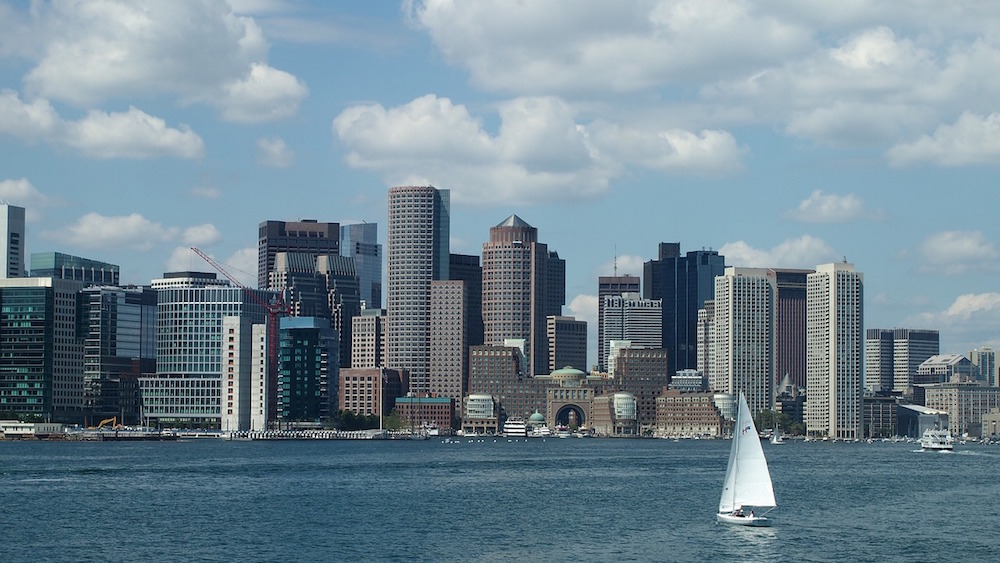
Total spent: $137.8 million
Average spent per household: $75.04
7. Baltimore, MD
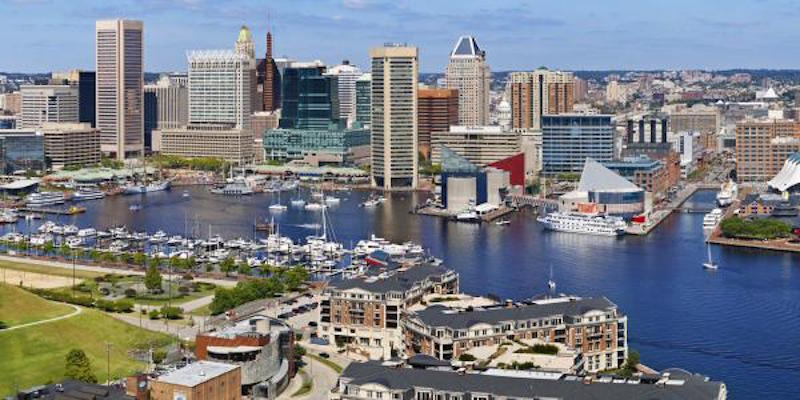
Total spent: $78.9 million
Average spent per household: $74.19
8. Honolulu, HI
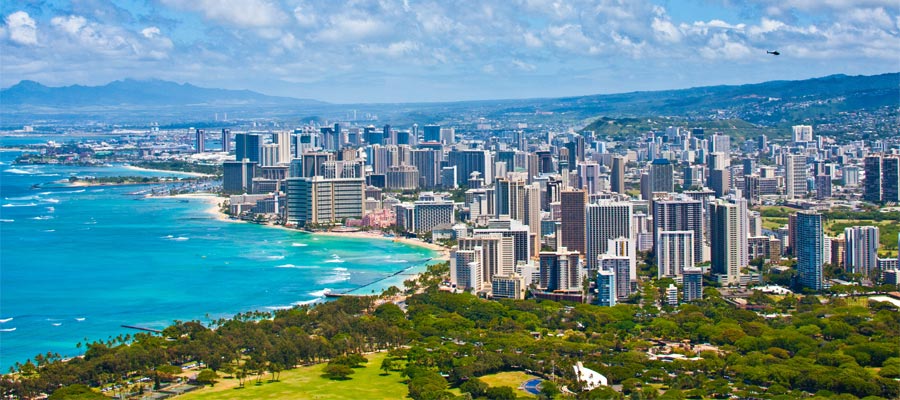
Total spent: $23.9 million
Average spent per household: $74.14
9. New York, NY
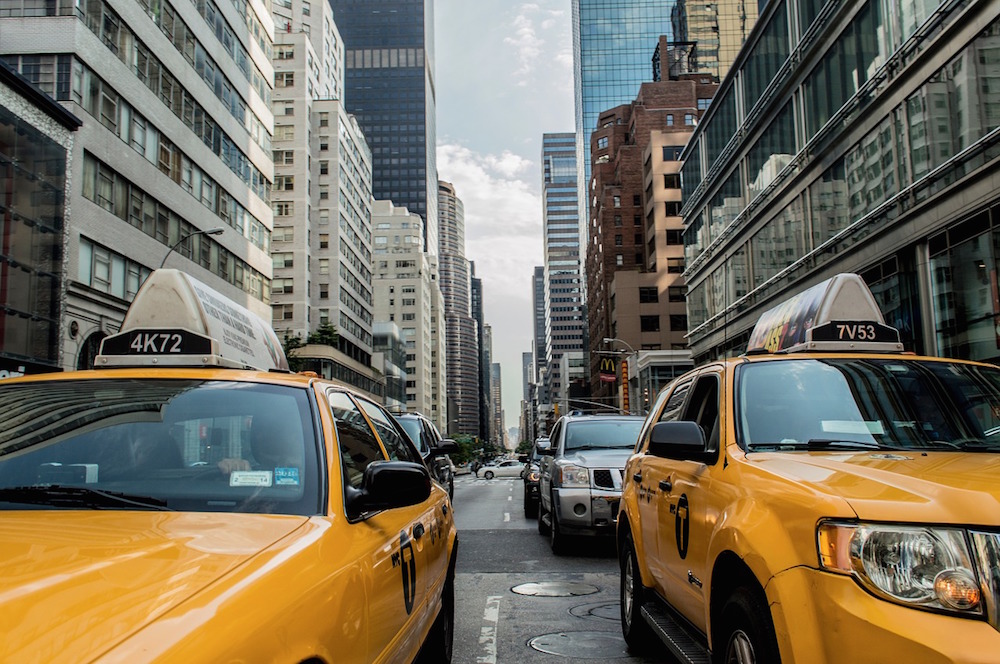
Total spent: $529 million
Average spent per household: $72.17
10. Hartford, CT
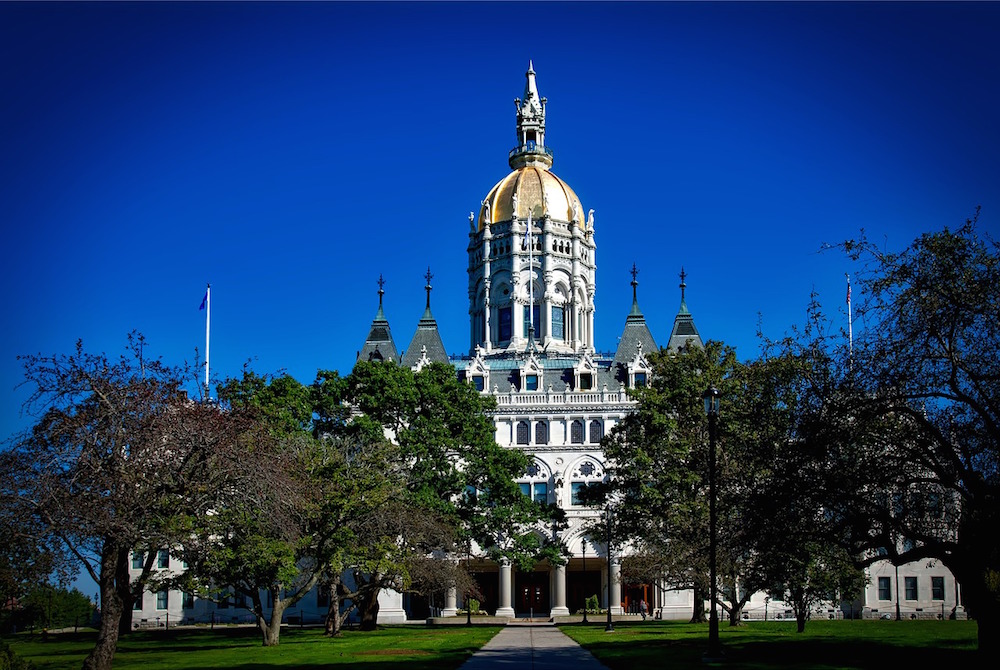
Total spent: $33.4 million
Average spent per household: $70.95
11. Seattle, WA
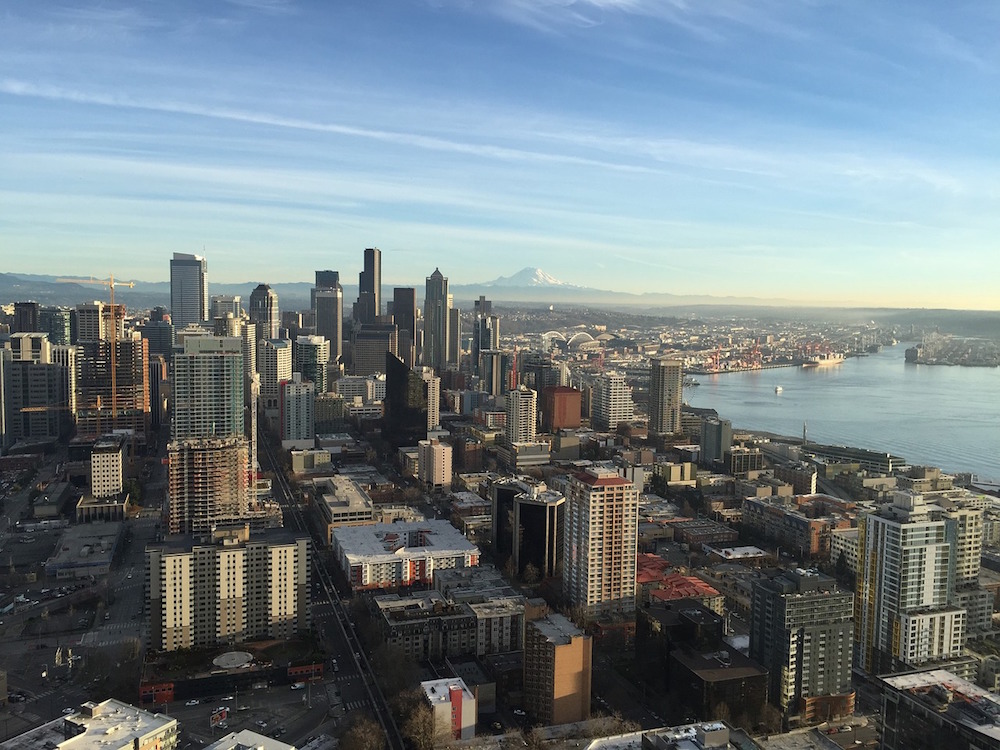
Total spent: $103.1 million
Average spent per household: $70.00
12. Minneapolis-St. Paul, MN
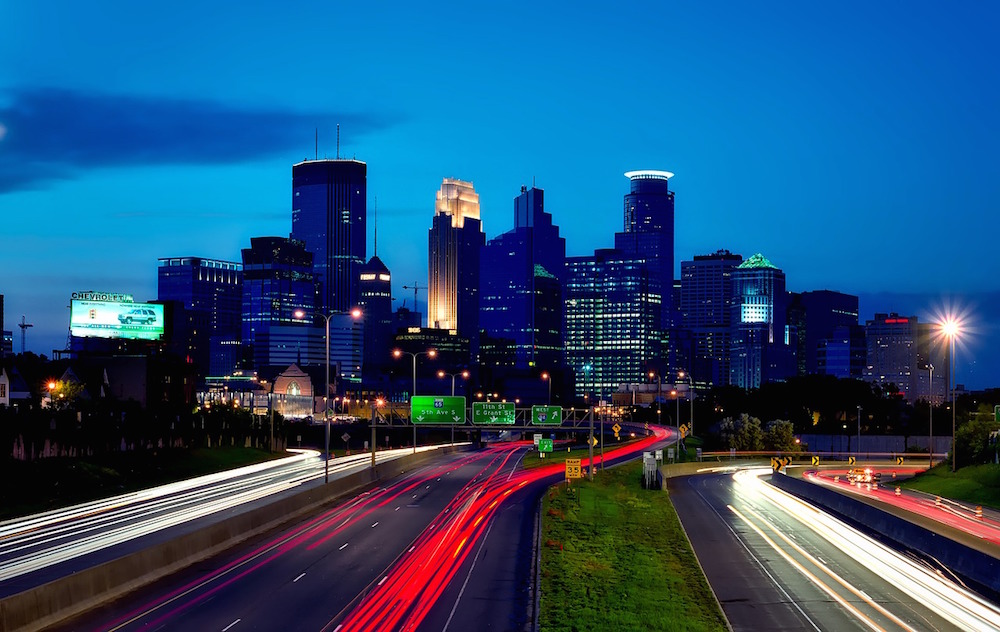
Total spent: $93.5 million
Average spent per household: $68.41
